Understand Users through Visual Diagrams
Each time the UX team conducts research, the information collected must be analyzed to ensure that feedback informs all design decisions. After different research methods are employed to learn about users’ behaviors and needs, the feedback must be analyzed to understand attitudes, behaviors, patterns and demographics. A variety of tools can help analyze the user and their goals, including user personas, empathy maps and user flows. In learning about users through these various tools, the design team can better understand if their assumptions were valid and identify other pain points to overcome for users. Once these measures are created, the next step is to determine the tasks the user personas are trying to complete when using the product, as well as the workflow they will be taking in doing so. Storyboarding is another technique that can be used to illustrate a “story” of how users go about interacting with your website or application.
WEB ANALYTICS
Patterns, trends and correlations of website visitors may be identified through analysis of website traffic data. Web analytics tools, such as Google Analytics or Adobe Analytics, assist with understanding target audiences using data visualization. By collecting, tracking, analyzing and monitoring usage metrics (e.g., visits, unique visitors, page views, sessions, mobile visits, page/visit, visit duration, bounce rate, and traffic source), the UX team can better understand patterns and behaviors of users to aid in design. These tools are another means of intel to assist with the creation of wireframes and prototypes.
Heat maps are another data visualization tool that utilize color coding to analyze user behavior. The intensity of the colors graphically depicts users’ interactions with the site—how far they have scrolled down a page, what they have clicked on, what they spend the most time on—allowing the UX team to learn of issues and help improve user experience. There are many heatmap software tools, such as Crazy Egg, Lucky Orange and Mouseflow, that offer free and paid plans.
INFORMATION ARCHITECTURE
When users navigate your website or app, they must be able to quickly find what they are looking for. This logical flow of content, also known as information architecture (IA), is a crucial aspect of UX design. The UX team must determine how to organize the content in a meaningful manner for users to navigate your digital product. To design the optimal structure, the UX team will have to gain a good grasp of the site’s functionality and also have a full inventory of all the content. One way to assist with the organization is via card sorting, which helps by grouping topical areas together. In this method, users organize the content for the site or app by grouping and labeling them in ways that appropriately describes it.
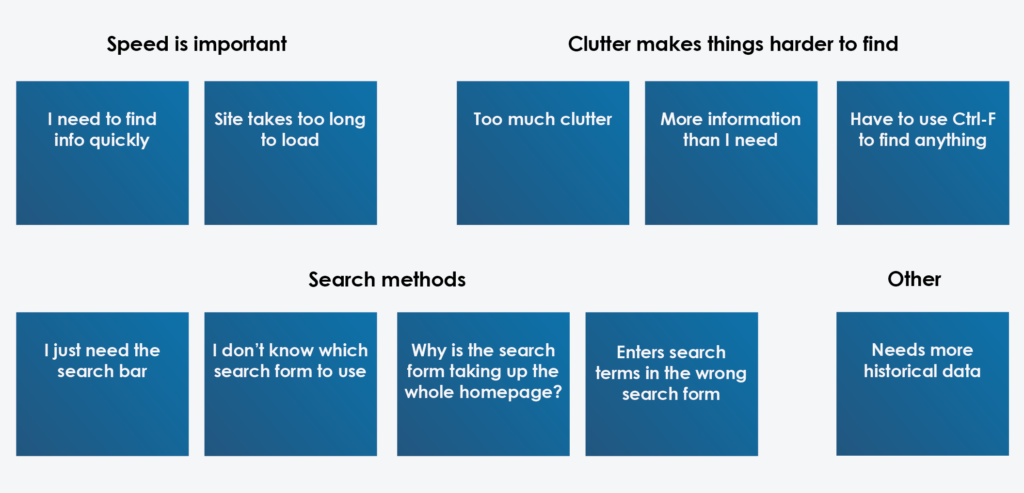
By taking comments from the research conducted with users and organizing the themes that emerge into categories for structure and labels, the UX team can prioritize how the content should be arranged in a meaningful and accessible manner. If you have an existing product, a content audit may be conducted to create a comprehensive list of all the content and tasks available to users. This process of cataloging and organizing content on your site permits the development of a site map. Site maps show the structure of the navigation, as well as how pages are related to one another. The visual representation shows where content is located and depict the way users will navigate the site.
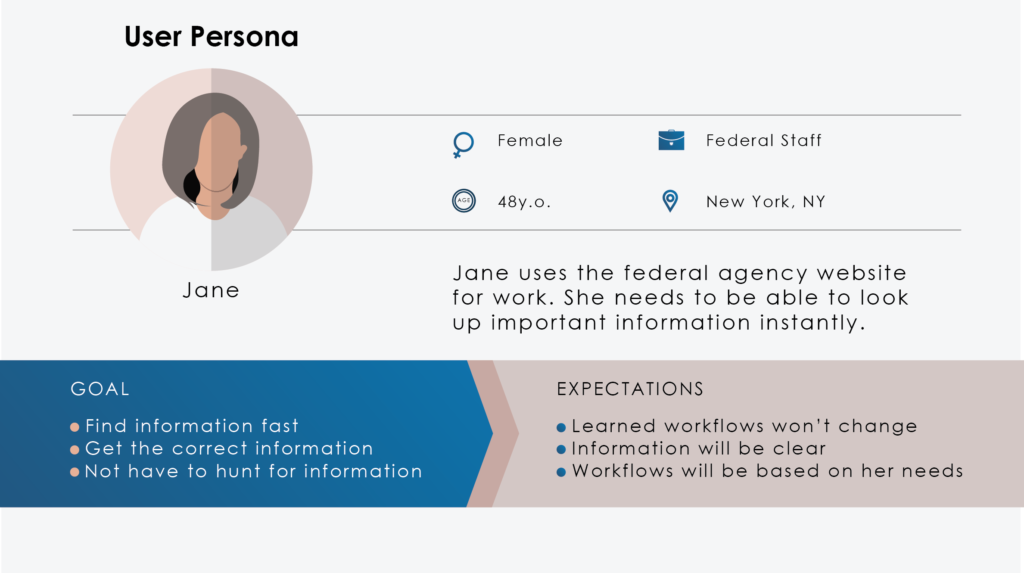
CREATE USER PERSONAS
User personas are character profiles of current users that are used to depict the characteristics of the entire population of users. These archetypes provide an understanding of and compassion for users of your product. User personas may include goals, skills, motivations, needs, attitudes and behaviors that provide a comprehensive picture of all the different types of users in our target audience. To create a realistic individual for each persona, the UX team may add hobbies, likes/dislikes, background, profession and demographic information, as well as quotes from actual users to form a well-rounded profile. The end result of the personas is that they fully represent users’ needs and goals.
DEFINE EMPATHY MAPS
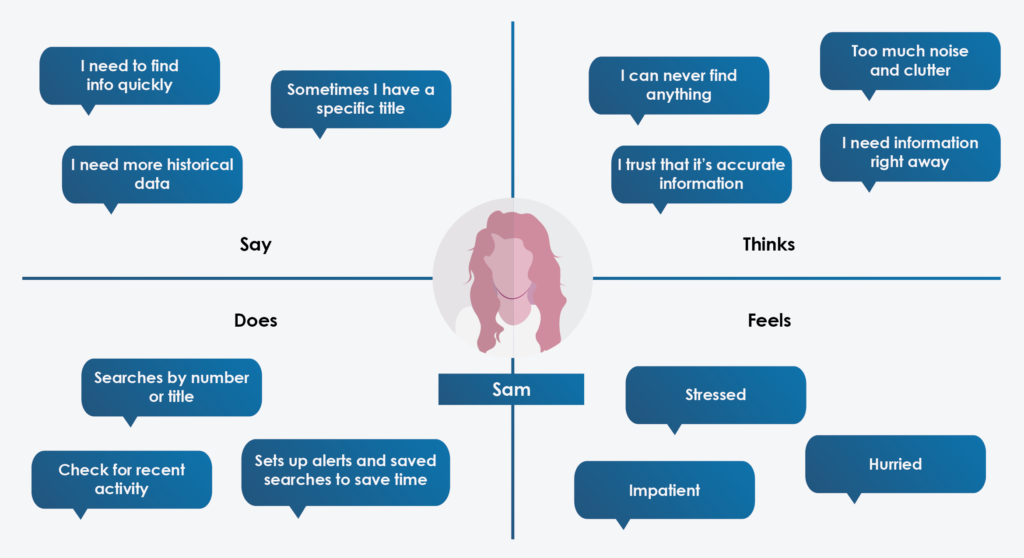
An empathy map may be used to visualize your knowledge of specific types of users and enable a collective understanding of their needs to help make key decisions with clients and stakeholders. Empathy maps can be constructed for different types of users to record their interaction with the product. The mapping information provides a snapshot of how they feel and their needs as they relate to using the product. There are four quadrants in an empathy map—Says, Thinks, Does and Feels. The “Says” quadrant has quotes from user interviews, while the “Thinks” quadrant describes what users are thinking throughout their interaction with the product. The “Does” quadrant includes what actions users are taking; whereas, the “Feels” quadrant records what emotions they are experiencing throughout the interaction process.
CREATE USER FLOWS
User flows are another tool that the UX team can use to visualize the process that users go through in their interaction with the product. These maps can be used to illustrate the exact steps that have to be accomplished for each task. They begin with a timeline of user actions that occur during the interaction process, so they are usually used in situations where a sequence of events or workflow occurs for a product. Within the timeline, the specific type of users’ thoughts and feelings are added to give additional context to the narrative. Providing a visual representation of the users’ workflow provides opportunities to simplify or enhance the process.
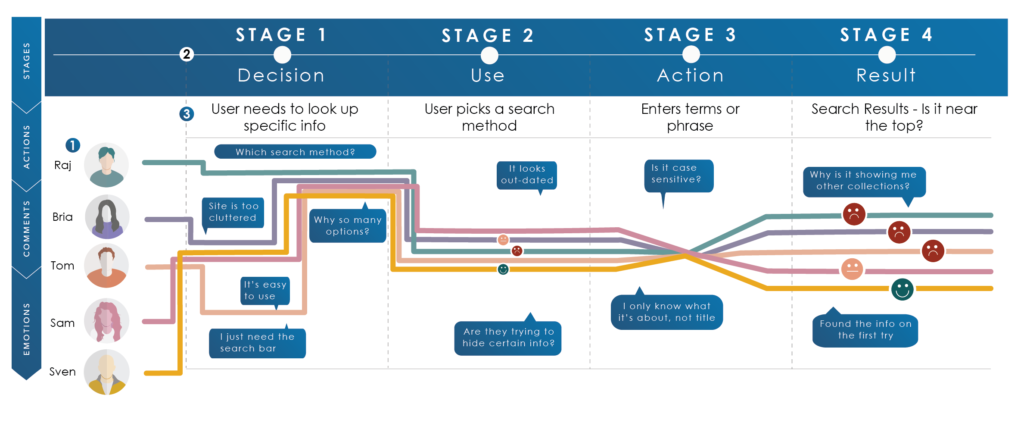
The key components of user flows include:
- User Groups – the type of user that is being described is shown. Each individual viewpoint should be described to show their respective workflow.
- Workflow Phases – the high-level stages of action in the process that may differ for each type of user. Each user might achieve their goals in slightly different ways, but their behaviors can usually be grouped into high-level categories.
- Actions and Emotions – actions describe the user’s behavior and the steps taken within each phase; emotions are often quotes corresponding to the phase from the user research that highlight the user’s thoughts, motivations and views. They are plotted along a single line showing the user’s ups and downs in their experience.
CHECKLIST
- Pinpoint metrics and web analytics that gauge usage information
- Determine which analysis tools or methods to interpret interviews and survey data
- Conduct website audit and catalog content and user activities as needed
- Analyze common patterns and themes from research
- Analyze pain points and challenges the product needs to overcome
- Comprehend different user types and their individual needs
- Understand the emotional feel and workflow experience for each persona
KEY QUESTIONS
- Do user personas provide an understanding of key characteristics and needs?
- How well do user flows allow break down of tasks to understand pain points of areas of improvement?
- Is an empathy map needed for learning about users or a particular task or decision?
- Would the card sorting technique help organize a website or prioritize content?
- What web analytics/metrics are available about current users? Which Key Performance Indicators (KPIs) for the final product should be considered?
- What technological factors impact the product’s user experience?
- Have features and functions addressed accessibility needs of all users of the product?
- Do the analysis tools selected illustrate a good understanding of user behavior and challenges?