

Introduction
Enterprise monitoring of infrastructure and applications is important in an organization to detect Information technology issues or problems as they occur. These issues happen in the form of messages (errors, informational messages, clear/acknowledgement) from different systems and applications. These messages are then processed and presented to provide meaningful information via dashboards and alerts. For instance, when an application writes messages to a logfile, we can monitor the application’s logfile for particular error strings and send out events and alerts when those known error conditions occur.
For a large federal agency, Artemis has a contract to currently monitor the agency’s infrastructure using various enterprise monitoring tools, including IBM Tivoli suite of applications, such as Network Operations Insight, and Internet service monitors, such as Prometheus, Cacti, and Elasticsearch/Kibana, as well as other custom monitoring. In addition, we provide potential upgrades to the system, such as the Cloud App Management tool (for applications) and Network Performance Insight (for NetFlow monitoring).
Infrastructure Monitoring
We monitor the network infrastructure using simple network management protocol version 3 (SNMP v3) via traps/informs and polls. An SNMP trap is a message that is usually sent when a change of state occurs in the managed network device. Examples of SNMP messages include: link down/up, authentication failures, and others. Network devices are polled by the network management systems (IBM Tivoli Netcool) via SNMP (in this case, Cacti and IBM Tivoli network manager), and a response is generated. In addition, network devices also send syslog messages to the syslog server for forensic activity and certain messages (via rules) are then sent to the network management system. Infrastructure monitoring ensures that network or infrastructure related issues are quickly addressed. One example is monitoring the WAN links and sending alerts when the bandwidth utilization is over a certain percentage; thereby, checking for potential problems before they occur. This check ensures that the team is proactive rather than reactive in addressing issues.
Server Monitoring
Servers are monitored via SNMP polling of the devices. The metrics from SNMP polls are usually CPU, memory, disk, swap, load average, etc. These metrics are illustrated on a graph to see trends and investigate issues. In certain cases, agents are installed on servers. The IBM Tivoli monitoring agents collect metrics and logs. The following metrics can be collected via the monitoring agent: operating system and CPU performance, disk information and performance analysis, monitored logs information, and services information. The messages from the agents are sent to the Network Management System (NMS), and events are created based on defined rules. Once again, the server monitoring helps the server teams to be in line with issues as they occur. For example, when a server loses one of its power units, the monitors ensure that the server team will receive an alert regarding the problem. This monitoring helps to quickly address the problem in a preventive means rather than be reactive when the server goes down completely. In addition, thresholds are set on servers for key metrics (such as CPU usage %), and alerts are sent when the metric values spikes over the threshold. These thresholds help to troubleshoot the issue before potential problem occurs.
Application Monitoring
Applications are monitored via Internet protocols, such as HTTPS, DNS, and various other protocols. The URLs of applications are monitored to check for availability of web sites. Custom scripts are used to also monitor and obtain logs from applications. In addition, the IBM Tivoli Netcool system is a monitor of monitors (MOM) in which other element managers (such as an Oracle Enterprise Manager) send messages to Netcool system via traps. Monitoring of applications provides high value to the application owners because the monitors provide instant alerts of potential issues before customers or end users notice. An application could have an issue with its backend that is not immediately noticeable via the frontend interface. However, the monitors will alert the issue, and it can be resolved before a major outage occurs to a public facing website.
Development of System Architecture and Project Plans
The monitoring system we have designed for the agency is architected for high availability and disaster recovery purposes. Figure 1 shows the simplified architecture of a monitoring system. It is architected across multiple data centers to provide high visibility, so that monitoring will be minimally impacted by a single system outage. As shown, information is fed to the monitoring systems via SNMP traps, SNMP polls, and logs. These messages are processed as events and then presented in a dashboard. At the same time critical events are sent via emails or tickets to engineers and management staff. This architecture is achieved using the applications’ high availability configurations and additional custom setups. Application upgrades and migrations are planned using project plans and work breakdown structure. System documentation is crucial and all system upgrades/migrations are documented to ensure continuity of operations.
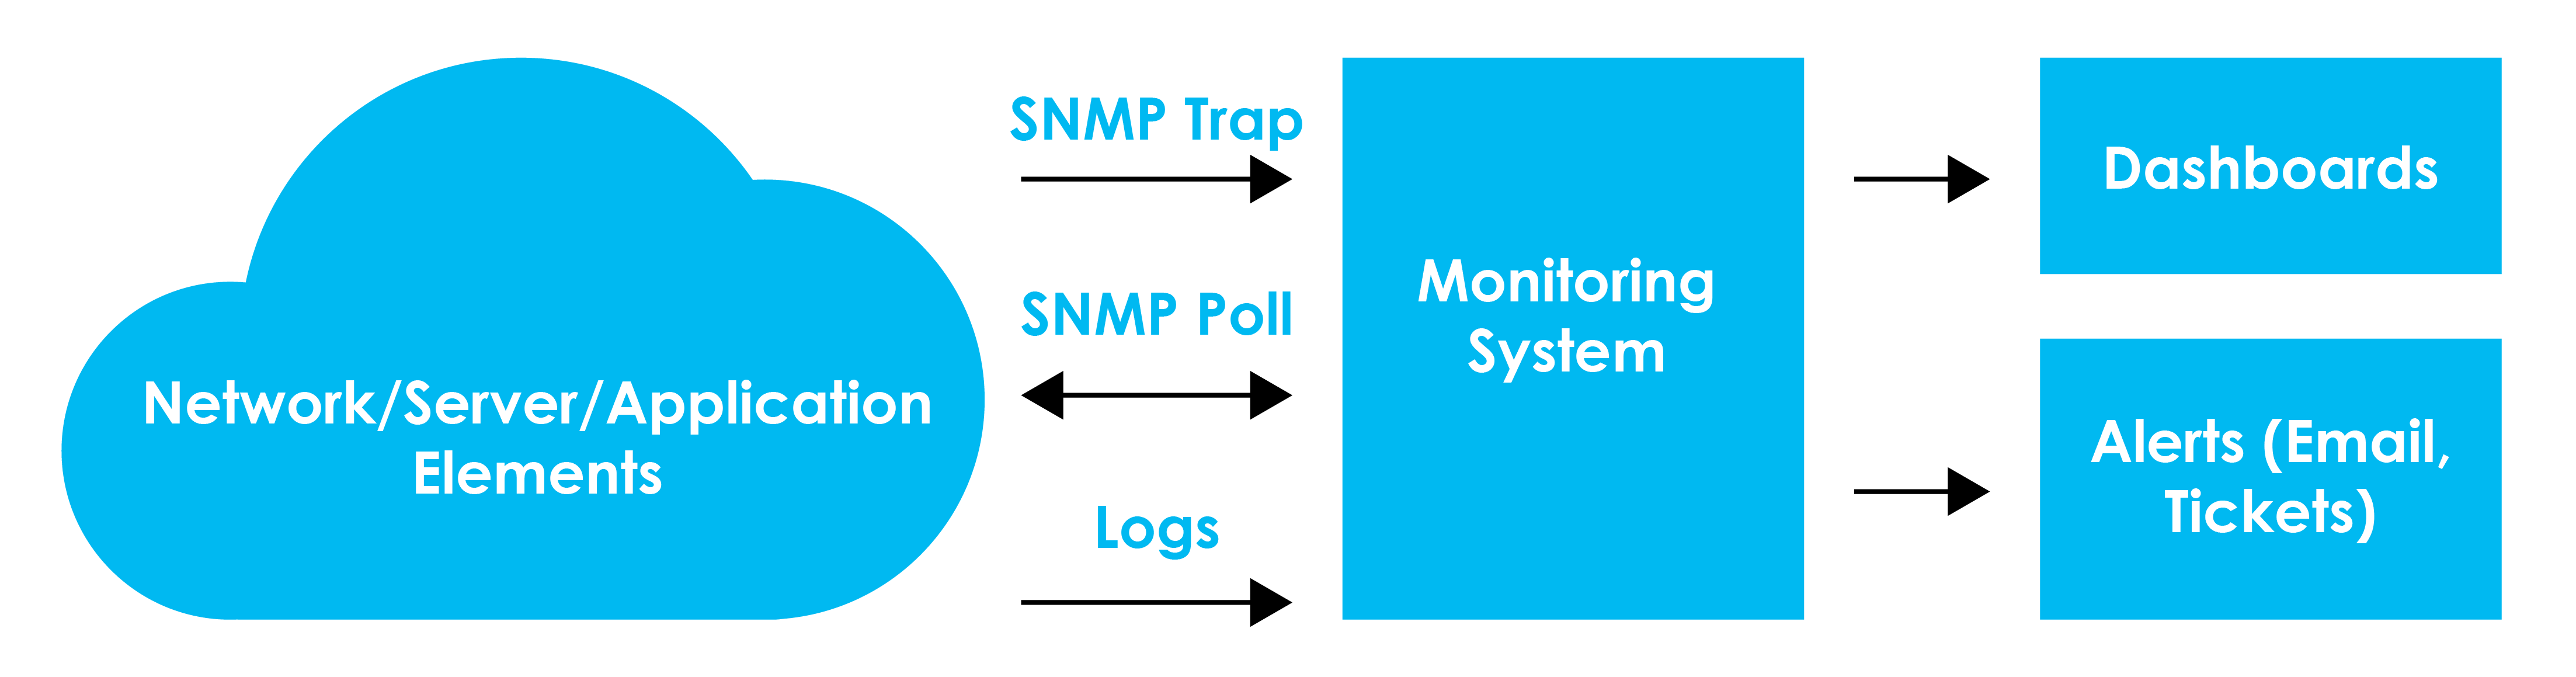
Figure 1. Network Monitoring Architecture
System Performance and Dashboard Development
Dashboards show a high-level view of the health of the systems or applications in an environment. They help to quickly identify problems, such as when a component like a database or webserver of a critical application is down. Dashboards can be presented in a hierarchical structure and can be configured for users to drill down to identity the specific problem areas. We created them using IBM’s JazzSM Dashboard Application Services Hub (DASH). Because they provide targeted information, different dashboards are built for different audiences, one kind for managers, one for engineers and one for helpdesk technicians. For instance, a manager will be interested in the overall system health of a division/organization; whereas, an engineer will be interested in systems within their specific domain.
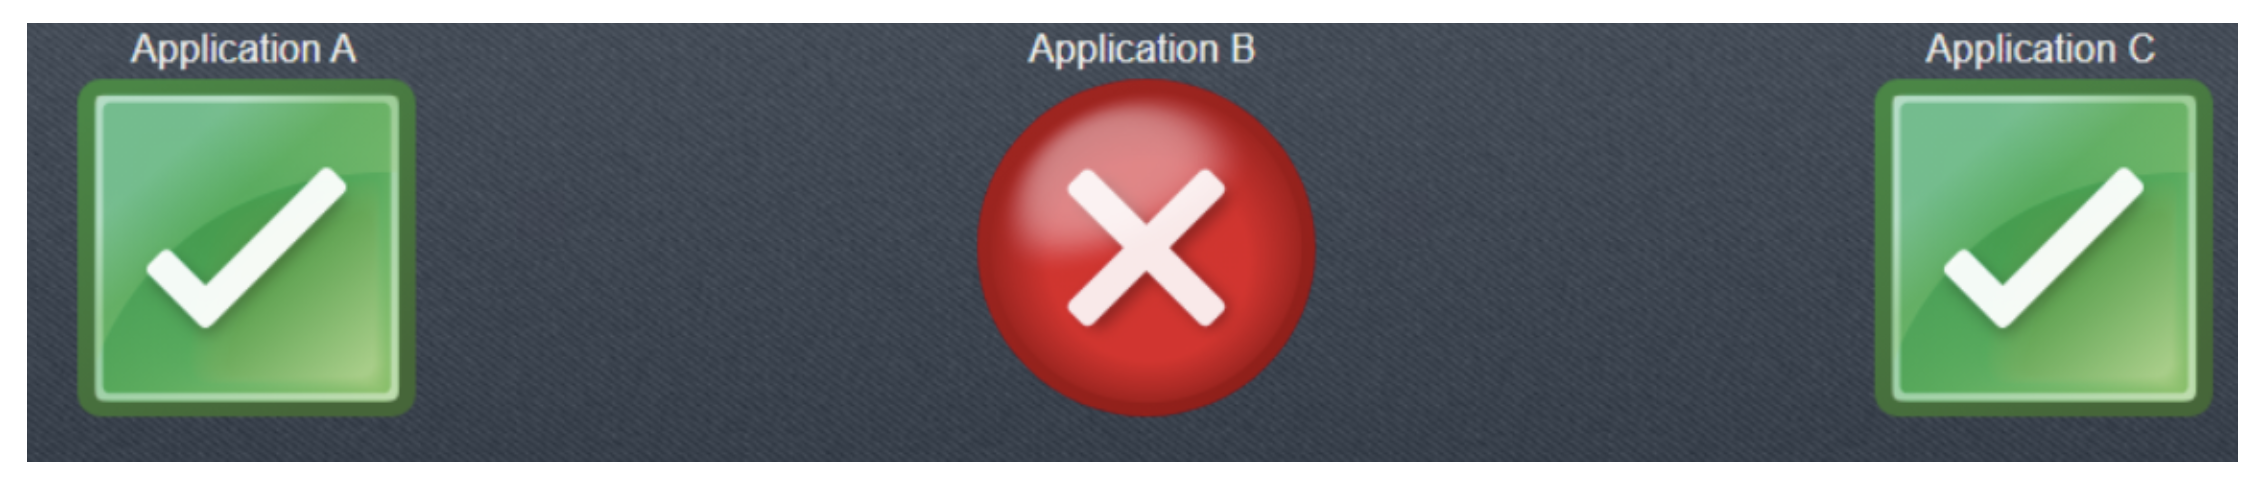
Below is a simple example of a dashboard for an IT group that support three applications. The green signifies that ‘Application A’ and ‘Application C’ are ok; whereas, the red shows that ‘Application B’ has an issue. The application engineers could drilldown from the dashboard to view the specific error.
System Documentation Development
The monitoring applications that are installed are usually commercial off-the-shelf products. Typically, vendors of these products, such as IBM, provide adequate documentation of the monitoring application. In addition, documents are created for unique configurations for the products and for custom script-based solutions. In the future, these documents will be placed in collaboration tools, such as Atlassian’s Confluence.
Future Trends in Enterprise monitoring
Most enterprise monitoring vendors are moving towards AIOps (artificial intelligence for IT operations). This is using artificial intelligence to enhance IT operations. AIOps uses trends/seasonality or correlated/related events to make decisions on potential outages and root causes. This requires all potential data such as logs, historical and real-time performance and event data, network data, etc. to be fed into the system (So it requires complete monitoring of the systems/application, in order to make root cause decisions). AIOps is becoming useful as more organizations move to the cloud. The benefits of AIOps is that it enables IT operation staff to proactively respond to potential outages. A big issue with traditional monitoring tools is how to differentiate real events from noise, and prevent “false” alerts (i.e. those that are not relevant to the problem). This is where AIOps come into play, it learns by using analytics to understand the events and notice abnormal events that could have significant impact.
An additional benefit of AIOps is that IT operation teams only receive major impacting alerts with root causes to the problem and potential solutions thereby reducing time to troubleshoot.
Cloud-Based Systems
Cloud-based monitoring can occur in various forms. One approach is for the software as a service (SaaS) provider to have the tools necessary to monitor the cloud systems, typically performed outside the enterprise. For example, the Amazon Web Services (AWS) cloud or Azure platforms are one such service in which Amazon/Azure tools exist to monitor the cloud platform. Another approach is to use existing in-house tools to monitor applications and services running in a cloud platform. The monitoring system can then combine metrics from the cloud with those received in the datacenter to provide a complete picture of the organization. Most enterprise monitoring tools in this scenario already have plugins to most cloud providers. The IBM Cloud App Management is an example of a monitoring tool that has the ability to monitor the cloud environment. Monitoring of the cloud platform goes beyond the servers that support the cloud infrastructure to also include the applications that reside within the cloud. An example of monitoring that can be offered at the infrastructure level is user traffic to the cloud platform.
Conclusion
Enterprise monitoring is important in an organization because monitoring helps to effectively manage IT systems and applications. It also enables organizations to have an effective plan for their IT systems and applications, preventing problems that can go undetected for hours. In essence, an effective enterprise monitoring strategy will reduce the average time to repair problems and increase the availability of applications.
The Artemis Consulting Team helps monitor, manage, learn and adapt enterprise monitoring large Federal agencies and organizations. Contact us if you are interested in learning about our capabilities.